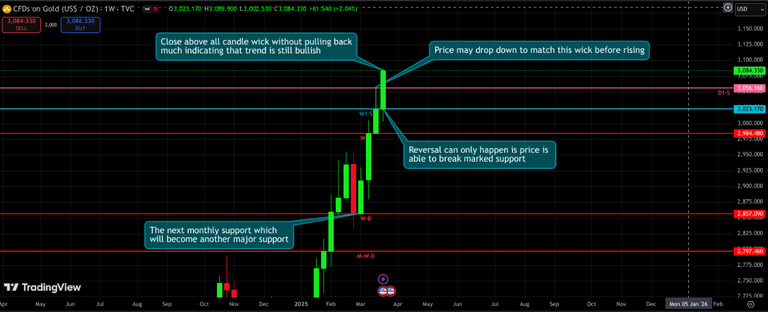
We'll first be looking at the weekly timeframe since it's closed. Its candle has become a new support and if a reversal was to occur, it would have to at least break its own support at 3,023.17 and to break means to close below that support too and not just crossing and pulling back. If all it's done is drop down crossing the support, then pulling back after leaving a low wick below that support but without touching the next support which means the charts isn't reversing but just crashing down to clear buy volumes from that market as much as possible before continuing on its trend. But sometimes the market can do the impossible and crash further than expected to not just clear buy volumes from the market but to lure and accumulate more buy volumes from the market by crossing every support there is to lure people into buying and filling every buy limit, then crashing continuously until most trader's account burst or at least lost a lot of their capital before pulling back or start reversing.
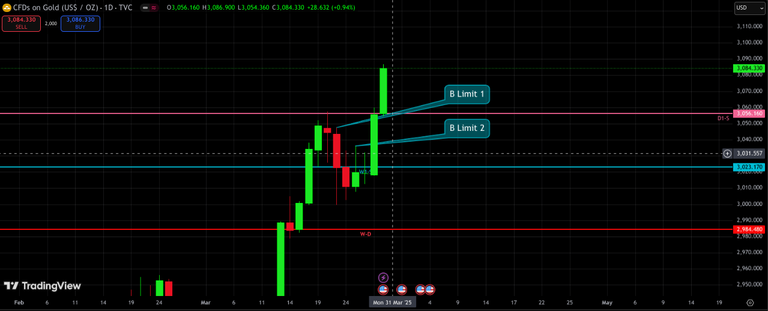
The daily timeframe shows a new high and a bullish candle closing above the previous candle wicks which means the trend is still bullish. Right now we should still be looking to enter a buy position, so where is the best possible price especially if you don't wanna deal with too much of a drawdown? I've marked the wick where I would've place my buy limits because it's the spot the price would have a chance of reaching if it's looking to clear buy volumes from the market but wouldn't touch the next major support if it's not gonna allow more buy volumes into the market. Though the Buy Limit placement is quite a safe order I would say, but would never place all my eggs in that one basket because the unexpected could happen anytime you're distracted from the charts. So the best possible action is to check often whether the price is slowly descending to touch each support or is it breaking below to touch the supports because slowly descending and breaking out is a whole different thing to analyze. This would be another topic for me to explain in my later post about how each candle moves to touch/cross support and resistance because the way it moves to each spot in the chart tells a lot about it's bar actions.
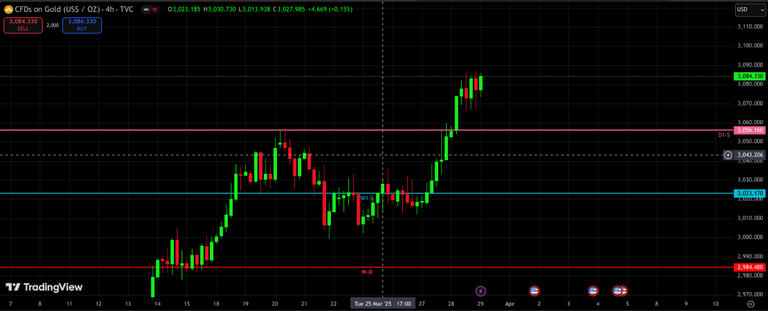
The 4 hour timeframe shows the price consolidating after a break out. So now we have to check if there is still an unfilled fair value gap, so prices have a chance of clearing buy volumes at the unfilled fair value gap before rising further. And since price can't do a reversal after a consolidation, then right now in the 4 hour timeframe isn't the time to reverse yet which means if the price drops after the 1st opening candle, it is to clear buy volumes before going back up and whether it'll bounce back at the fair value gap that'll be for you to decide like how I've said that the way price reach each points in the charts has a meaning to it. A breaking out to each support and resistance or slowly ascending and descending to support and resistance has a different meaning to each. So try to do your own test to see how price reach each zone in the charts and how it'll react after that and you'll get what I mean.
Gold really has an exceptional value. It was just the right time to stock up in 2022. From what I know, lately gold has been bought in these years mainly by central banks, China, Russia, India and Turkey.